The PDB Coordinate File Format And Its Content
Consider using this if you need to provide more context on why you do what you do. Be engaging. Focus on delivering value to your visitors.
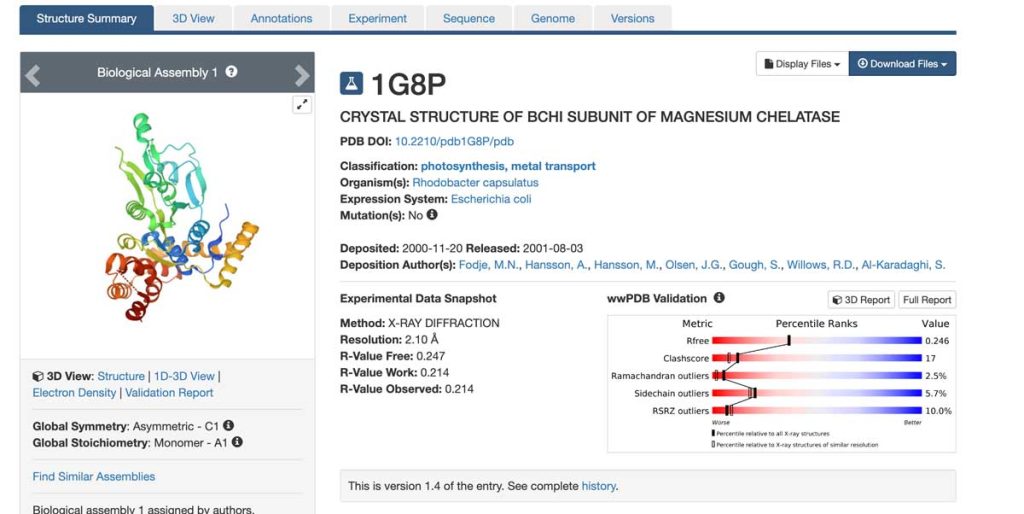
We continue our discussion of the PDB and examine the coordinate file – it’s easy to download a PDB file (and it’s free!). We just need to type in the name of the protein in the search bar when we arrive at the RCSB PDB site. After finding the protein of interest (1G8P in the image below), we click on it to be directed to the protein-specific page. In the upper right corner of that page is a drop-down menu labeled Download Files. When clicked, it provides several options for PDB file formats (click the image below; for a better mobile view, please click here). The PDB format file (not the gz-file, which is a compressed file) is a text document that can be opened by any text editor (including MS Word). Typically, this file is referred to as a coordinate file because it contains a list of coordinates for all atoms of the protein structure in a conventional orthogonal coordinate system. As in any coordinate system, the position of each atom is defined by its x,y,z coordinates.
In addition to the coordinates, the file also contains essential information about the method used to solve the structure, the parameters related to the quality of the X-ray data (such as resolution, R-factor, etc.), as well as the symmetry operations specific to the crystal’s space group, the quality of the model geometry (deviations of bond lengths, bond angles, and torsion angles from ideal values), secondary structure content, and a description of missing regions in the structure (which results from weak electron density due to flexibility or disorder in the structure).
The R-factor and resolution are the two most important parameters for assessing structural quality. The R-factor indicates how well the structural model fits the X-ray data (the electron density). A higher resolution of the X-ray data typically results in a better fit and a lower R-factor. Good-quality, well-refined protein structures generally have a resolution of 2.2 Å or better and an R-factor below 20%. At this resolution, the electron density for most atoms appears clear and well-separated from neighboring atoms. Please refer to the Experimental section for more details on the X-ray crystallography experiments.
Below is part of a PDB file header showing some of the data like resolution (2.1 Å), resolution range of the data (from lowest, 29.55 Å to highest, 2.10 Å), the number of X-ray reflections collected from the crystal during the X-ray experiment (22179) and the R-factor (0,214). The R-factor is ok but not great in this case. This is due to the high flexibility of parts of the structure, making reliable model building impossible. This is because parts of the model have not been accounted for, which results in a poor fit of the model to the experimental data.
REMARK 1
REMARK 2
REMARK 2 RESOLUTION. 2.10 ANGSTROMS.
REMARK 3
REMARK 3 REFINEMENT.
REMARK 3 PROGRAM : CNS 1.0
REMARK 3 AUTHORS : BRUNGER,ADAMS,CLORE,DELANO,GROS,GROSSE-
REMARK 3 : KUNSTLEVE,JIANG,KUSZEWSKI,NILGES, PANNU,
REMARK 3 : READ,RICE,SIMONSON,WARREN
REMARK 3
REMARK 3 REFINEMENT TARGET : ENGH & HUBER
REMARK 3
REMARK 3 DATA USED IN REFINEMENT.
REMARK 3 RESOLUTION RANGE HIGH (ANGSTROMS) : 2.10
REMARK 3 RESOLUTION RANGE LOW (ANGSTROMS) : 29.55
REMARK 3 DATA CUTOFF (SIGMA(F)) : 0.000
REMARK 3 DATA CUTOFF HIGH (ABS(F)) : 312841.620
REMARK 3 DATA CUTOFF LOW (ABS(F)) : 0.0000
REMARK 3 COMPLETENESS (WORKING+TEST) (%) : 97.9
REMARK 3 NUMBER OF REFLECTIONS : 22179
REMARK 3
REMARK 3 FIT TO DATA USED IN REFINEMENT.
REMARK 3 CROSS-VALIDATION METHOD : THROUGHOUT
REMARK 3 FREE R VALUE TEST SET SELECTION : RANDOM
REMARK 3 R VALUE (WORKING SET) : 0.214
REMARK 3 FREE R VALUE : 0.247
REMARK 3 FREE R VALUE TEST SET SIZE (%) : 10.000
REMARK 3 FREE R VALUE TEST SET COUNT : 2207
REMARK 3 ESTIMATED ERROR OF FREE R VALUE : 0.005
REMARK 3
Further down, we can find a list of the secondary structure elements within the structure, also showing the first and last residue in each element:
HELIX 1 1 PRO A 22 ILE A 26 5 5
HELIX 2 2 GLN A 29 ASP A 42 1 14
HELIX 3 3 PRO A 43 GLY A 46 5 4
HELIX 4 4 ASP A 53 GLY A 57 5 5
HELIX 5 5 SER A 59 LEU A 69 1 11
HELIX 6 6 ASN A 84 ILE A 88 5 5
HELIX 7 7 SER A 114 GLY A 120 1 7
HELIX 8 8 ASP A 123 GLY A 131 1 9
HELIX 9 9 GLY A 138 ASN A 144 1 7
HELIX 10 10 GLU A 152 LEU A 156 5 5
HELIX 11 11 GLU A 157 GLY A 171 1 15
HELIX 12 12 ARG A 202 ASP A 207 1 6
HELIX 13 13 ASP A 220 ASP A 237 1 18
HELIX 14 14 ASP A 237 LEU A 263 1 27
HELIX 15 15 PRO A 264 VAL A 266 5 3
HELIX 16 16 PRO A 269 LEU A 283 1 15
HELIX 17 17 GLY A 287 GLU A 305 1 19
HELIX 18 18 GLY A 311 SER A 324 1 14
HELIX 19 19 HIS A 325 LEU A 327 5 3
HELIX 20 20 VAL A 341 LEU A 349 1 9
SHEET 1 A 5 VAL A 106 LEU A 109 0
SHEET 2 A 5 GLY A 146 ILE A 150 1 O TYR A 147 N VAL A 107
SHEET 3 A 5 PHE A 188 GLY A 194 1 O VAL A 189 N LEU A 148
SHEET 4 A 5 VAL A 48 PHE A 51 1 N VAL A 48 O LEU A 190
SHEET 5 A 5 LEU A 211 GLU A 214 1 O LEU A 211 N LEU A 49
SHEET 1 B 2 ILE A 72 VAL A 75 0
SHEET 2 B 2 VAL A 99 LYS A 102 -1 N ILE A 100 O ALA A 74
SHEET 1 C 2 ALA A 121 LEU A 122 0
SHEET 2 C 2 PHE A 135 GLU A 136 -1 N GLU A 136 O ALA A 121
SHEET 1 D 2 GLU A 172 VAL A 175 0
SHEET 2 D 2 ILE A 182 PRO A 185 -1 O ILE A 182 N VAL A 175
After the general information, the x,y,z coordinates of the atoms are listed:
ATOM 1 N ARG A 18 14.699 61.369 62.050 1.00 39.19 N
ATOM 2 CA ARG A 18 14.500 62.241 60.856 1.00 38.35 C
ATOM 3 C ARG A 18 13.762 61.516 59.729 1.00 36.05 C
ATOM 4 O ARG A 18 14.354 60.740 58.982 1.00 34.91 O
ATOM 5 CB ARG A 18 15.850 62.753 60.334 1.00 42.36 C
ATOM 6 CG ARG A 18 16.537 63.770 61.247 1.00 46.92 C
ATOM 7 CD ARG A 18 17.825 64.314 60.629 1.00 51.24 C
ATOM 8 NE ARG A 18 18.442 65.347 61.462 1.00 54.15 N
When looking over the coordinates, I’d like to point out that the structure begins at amino acid Arg 18, while amino acids 1 to 17 are absent. As mentioned earlier, the reason is poor electron density for these residues, which does not provide enough information to include them in the model (see the discussion on structure quality). Identifying the correct positions for the amino acids is impossible without the guiding electron density. This demonstrates that many PDB structures may have missing parts, sometimes in loop regions, and very often, it is a side chain (or side chains) on the molecule’s surface. In the worst cases, a whole domain may be missing.
The numbers after the first record in the file, ATOM, are sequential numbers representing the atoms in the list. The atom type follows this number; for instance, CA is C-α, the carbon atom to which the side chain of the amino acid is attached. Next comes the main chain carbon atom C, followed by the carbonyl oxygen O. Side chain atoms C-β, CG, and CD (beta, gamma, delta, etc.) are listed according to the Greek alphabet. Following the atom type, we encounter the 3-letter code of the amino acid (ARG in this case), followed by a letter indicating the chain identifier, which in this file is A. In cases where the structure comprises several polypeptide chains (e.g., as in the tetramers of hemoglobin and Pyruvate kinase discussed earlier), each chain receives its identifier, such as A, B, C, etc. The subsequent numbers (e.g., 14.699, 61.369, 62.050 for the first atom) represent the atom’s x,y,z coordinates. As previously mentioned, these coordinates detail the position of each atom in an orthogonal coordinate system. If we can define the positions of all atoms in the protein, we can also visualize the entire molecular structure.
In most cases, the x,y,z coordinates are followed by a number, mostly 1. This is referred to as occupancy. Due to local flexibility, the amino acid side chain may have two or more different conformations. These conformations can be distinguished in the electron density map of the structure. In this scenario, the crystallographer will build all conformations and refine a parameter known as occupancy (1 for full occupancy, < 1 for partial occupancies, with the sum always 1). In PDB files, alternate conformations are designated with “ALT.”
Defining the B-factor
The numbers in the last column of the file are referred to as the temperature factors or B-factors. The B-factor indicates the displacement of atomic positions, known as the mean-square displacement. Greater flexibility leads to larger displacements and, consequently, lower electron density. This occurs because the atoms of a flexible side chain (or other structural components) are distributed over a larger volume in space, resulting in lower density per unit volume. However, we should also consider that displacements from a mean value may reflect imperfect crystal packing of the molecules.
In most graphics software packages (e.g., PyMol) used for protein structure visualization, we can conveniently highlight the B-factors in a protein chain by choosing different colors for varying B-factor values. Areas with high B-factors are typically red (hot), while low B-factors are represented in blue (cold). Inspecting a PDB structure with this coloring scheme will quickly reveal highly flexible regions. The molecule’s core generally exhibits low B-factors due to the tight packing of the side chains (enzyme active sites typically located there). “Normal” B-factor values are usually between 15 and 30 (square Angstroms) but often exceed 30 for flexible regions. More discussion on the B-factor can be found on the page about structure quality.